Quarterly Annuity Update
Q1 2026: Annuity Placements Drive Continued Savings and Strategic Outcomes
As of March 31, 2026, our Pension Risk Transfer team completed 8 annuity placements totaling $59.8 million and covering more than 700 plan participants.
These transactions reflect a balanced mix of execution, with 38% supporting ongoing pension de‑risking strategies and 62% facilitating full plan terminations. This breadth underscores our ability to advise plan sponsors across the full spectrum of annuity transactions, from targeted risk transfers to comprehensive exit strategies.
Client outcomes continue to improve as well. Total annuity placement savings reached 3.2% in 2025, highlighting the value of our disciplined pricing approach, deep insurer relationships and ability to navigate competitive market conditions on behalf of plan sponsors.
We remain focused on helping organizations reduce risk, improve cost efficiency and execute annuity placements with confidence—regardless of market volatility or transaction complexity.
We remain focused on helping organizations reduce risk, improve cost efficiency and execute annuity placements with confidence—regardless of market volatility or transaction complexity.
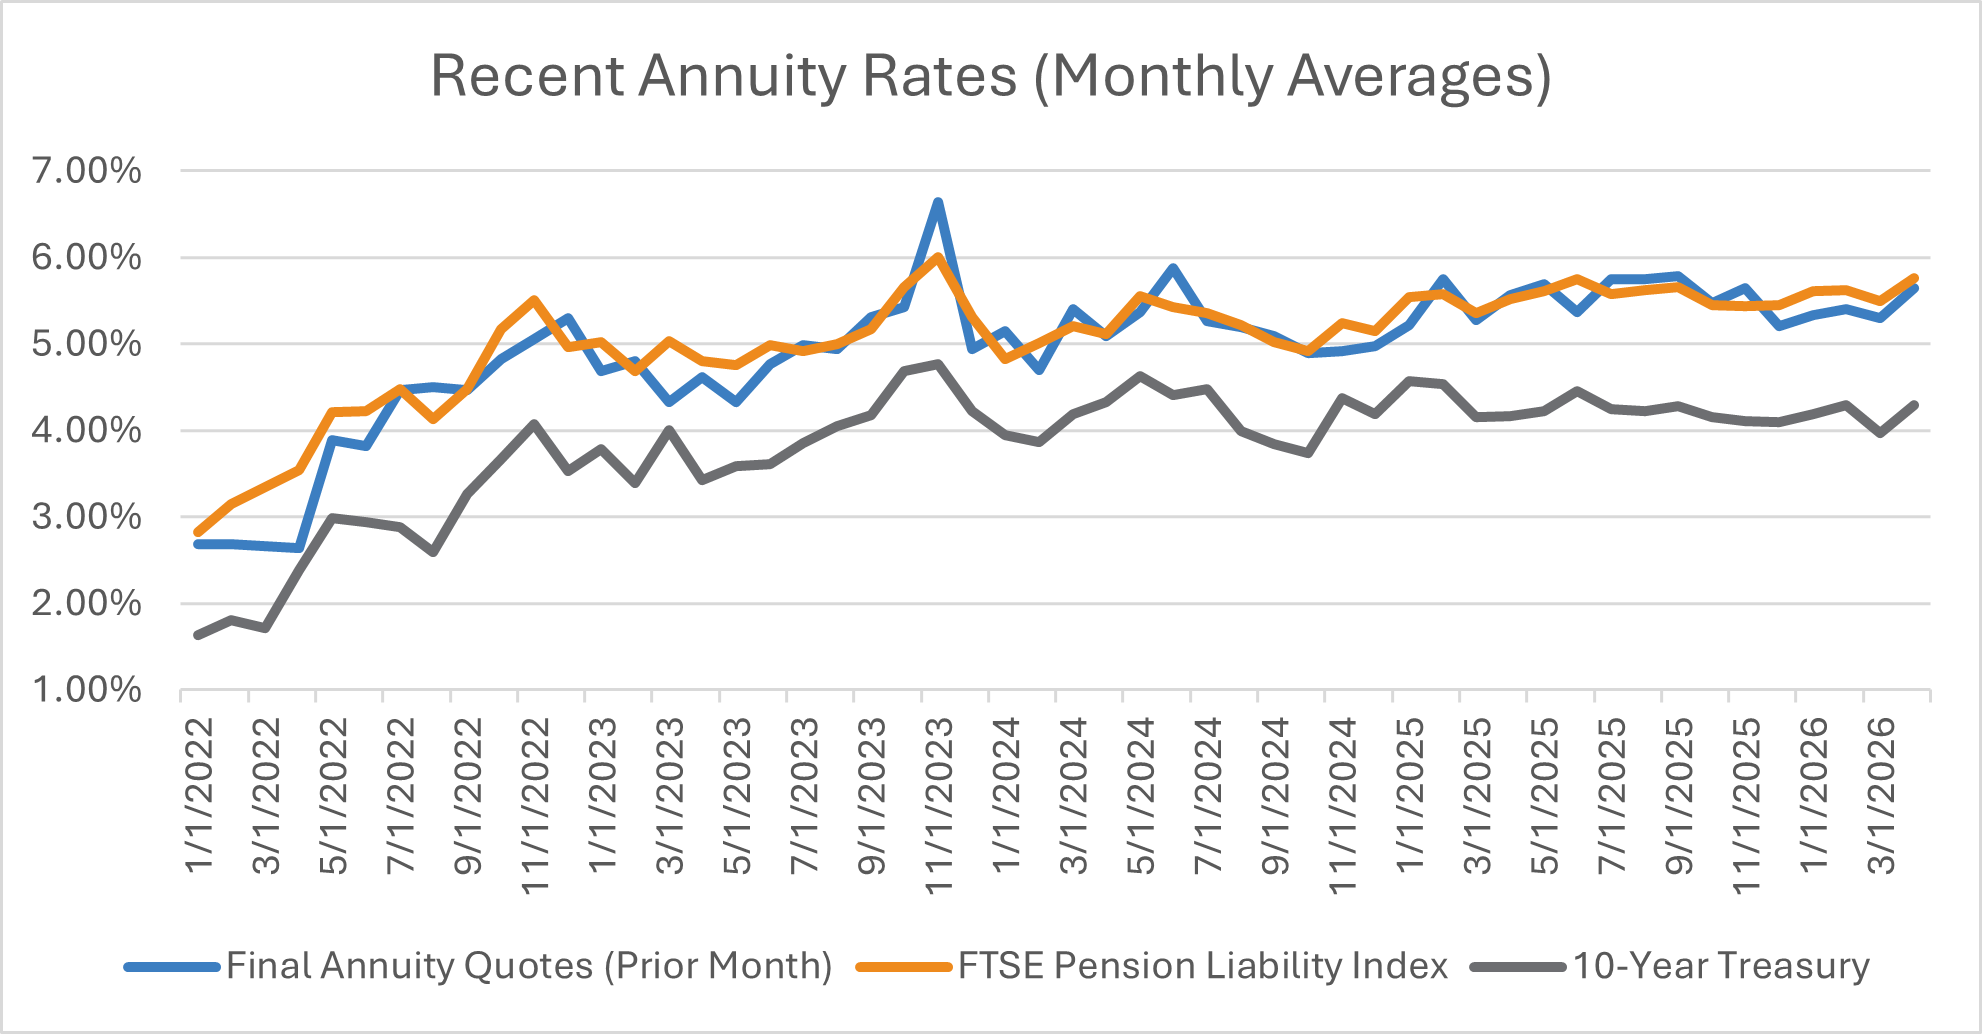
Sources: FTSE Pension Liability Index Report for Dec 2025; Treasury.gov; Morningstar
Pension Plan Landscape & Industry Trends — Pension Risk Transfer
Pension risk transfer strategies help plan sponsors reduce financial exposure by shifting pension liabilities to an insurance company. A buy-out is a standard contract in the industry, transferring assets and liability from the plan sponsor to insurance company. A buy-in locks in future buy-out pricing with no accounting settlement. The assets and liabilities are maintained within the plan and held in a contract with the insurance company.
U.S. Pension Risk Transfer Sales in 2025 Fall Short of a Record After Sales Volume Surge in Q4
2025 Marks the Third Strongest Year in History for Pension Risk Transfer Sales in U.S.
| $48.6 Billion in U.S. Pension Risk Transfer Sales for 2025 | Volume of 770 U.S. Pension Risk Transfer contracts in 2025 |
|
|
Sources: LIMRA Group Annuity Risk Transfer Sales Survey.
Observations from USI Consulting Group Annuity Placement Practice
|
Sales activity so far in 2026 off to a slower start after high volume in Q4 2025
|
New carriers are entering the market
|
Pension Plan Landscape & Industry Trends — Returns
EQUITIES MIXED IN Q1 2026 |
INTEREST RATES RISING IN Q1 2026 |
|
|
|
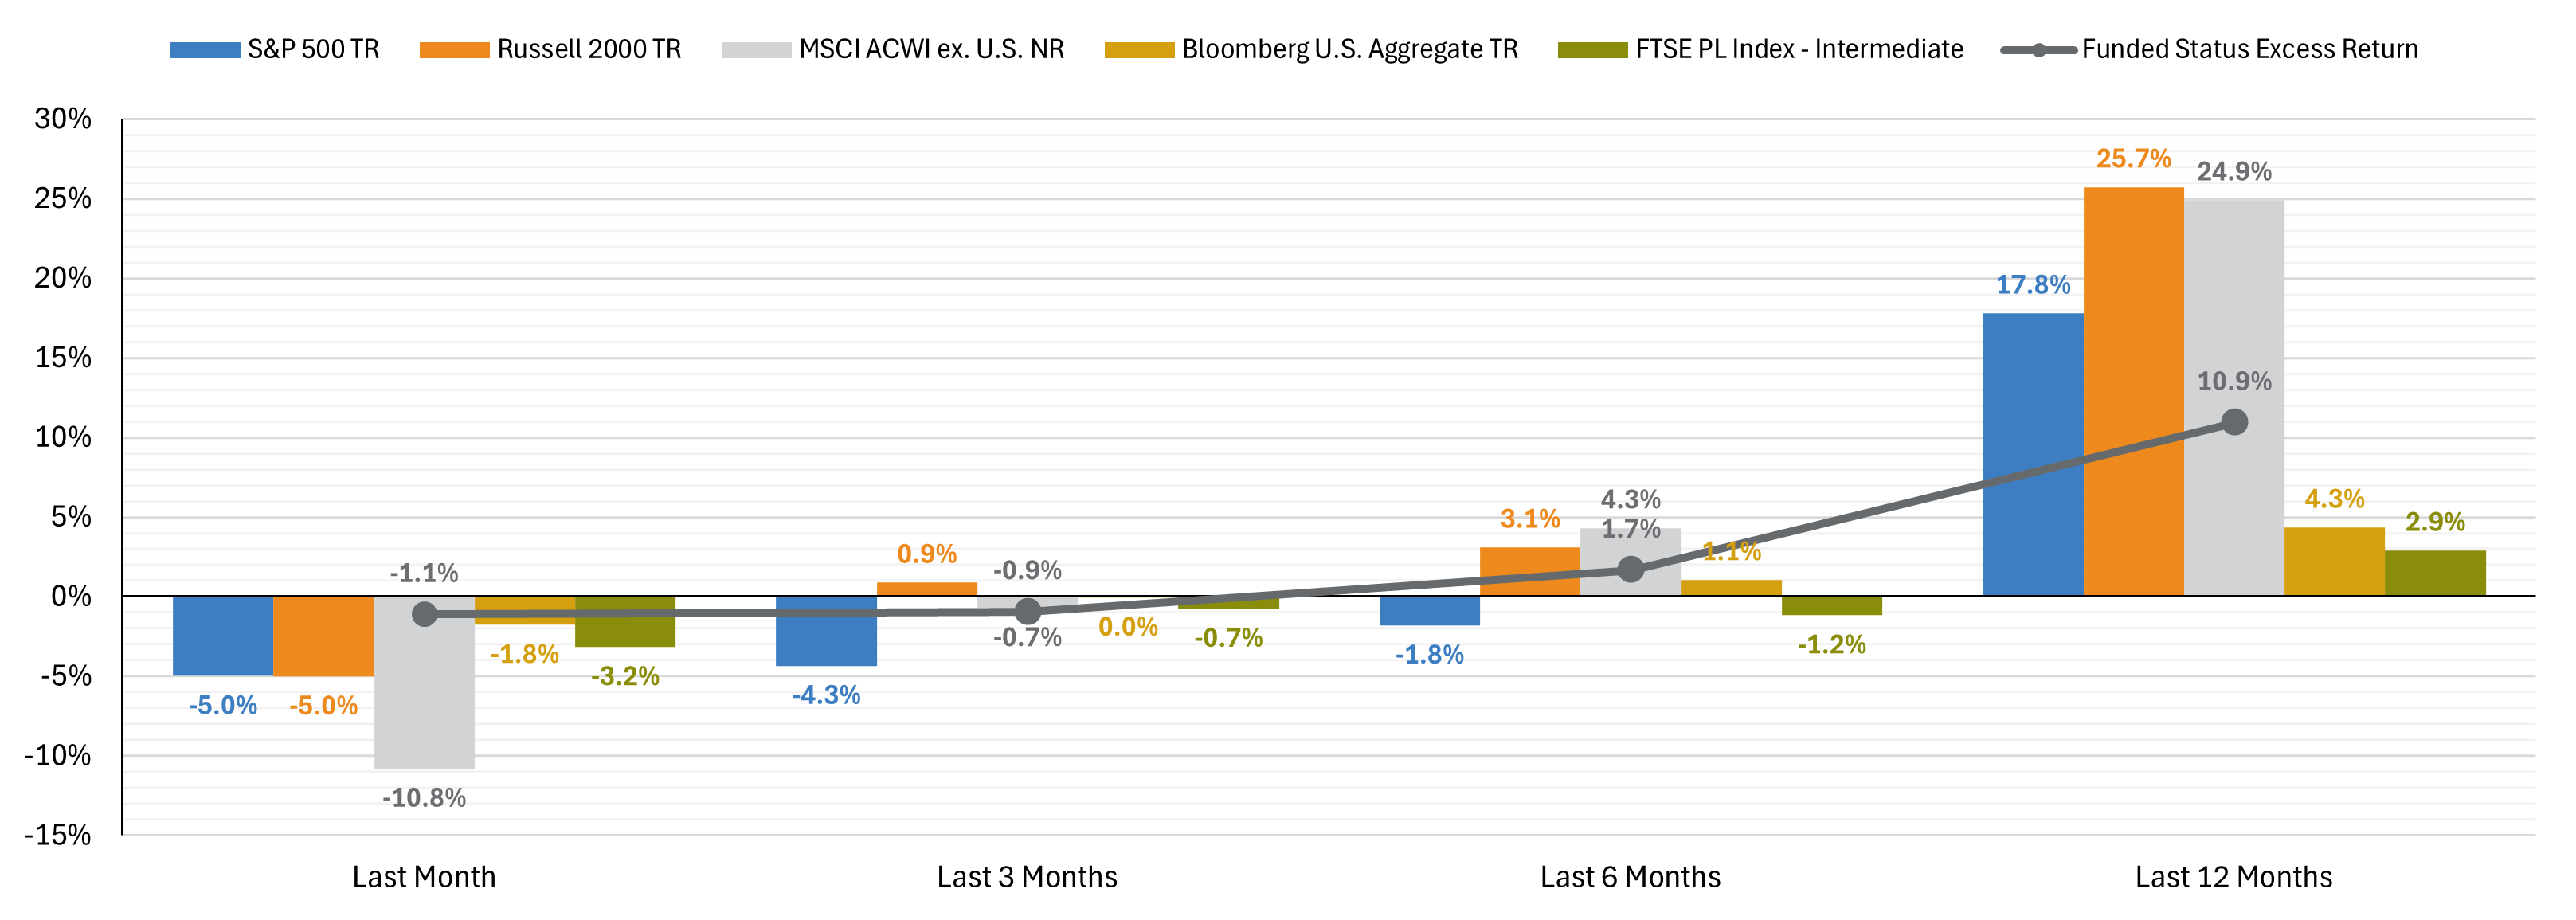
Strong equity market gains in Q3 2025 positively impact defined benefit (DB) pension plans by boosting asset values, which can improve funded status and reduce future contribution requirements. With U.S. large caps up 8.1%, small/mid caps up 12.4%, and international equities up 7.0%, plans with diversified equity exposure likely saw meaningful growth. This may also create opportunities for de-risking strategies, such as pension risk transfers, and can lower pension expense on corporate financial statements. |
Falling interest rates in Q3 2025 negatively impact defined benefit (DB) pension plans by increasing the present value of future liabilities. As Treasury yields declined—2-Year by 12 basis points, 10-Year by 8 basis points, and 30-Year by 5 basis points—discount rates used to value pension obligations likely fell as well. This leads to higher reported liabilities, which can reduce funded status even if plan assets performed well. Sponsors may face increased balance sheet volatility and higher pension expense, especially if asset growth doesn’t offset the liability increase. |
PENSION PLAN FUNDED STATUS DECLINED IN Q1 2026 |
CREDIT SPREADS HAVE WIDENED |
|
|
|
Improved funded status in Q3 2025 reflects strong asset performance relative to liability growth. A typical pension plan with a 60/40 equity-to-fixed income allocation saw assets increase by 6.0%, driven by gains across U.S. and international equities and bonds. Meanwhile, liabilities—based on a duration of 13–14 years—rose 3.1% due to falling interest rates. The excess asset return of 286 basis points over liabilities strengthens the plan’s funded status, potentially reducing future contribution needs and creating opportunities for de-risking or pension risk transfer strategies. |
Narrowing credit spreads in Q3 2025, reflected by a 13-basis point drop in the FTSE Pension Liability Index (from 5.58% to 5.45%) and its intermediate counterpart (from 5.46% to 5.33%), increase the present value of pension liabilities. For defined benefit (DB) plans, this means higher liability valuations, which can negatively affect funded status if asset growth doesn’t keep pace. Sponsors may see increased pension expense and greater balance sheet volatility, especially for plans using corporate bond yields to discount liabilities. |
Sources: Morningstar, U.S. Treasury, FTSE Pension Liability Index Report. Data as of December 31, 2025.
Pension Plan Landscape & Industry Trends — Monitoring
PENSION LIABILITY INDICES |
PENSION LIABILITY CURVE |
|
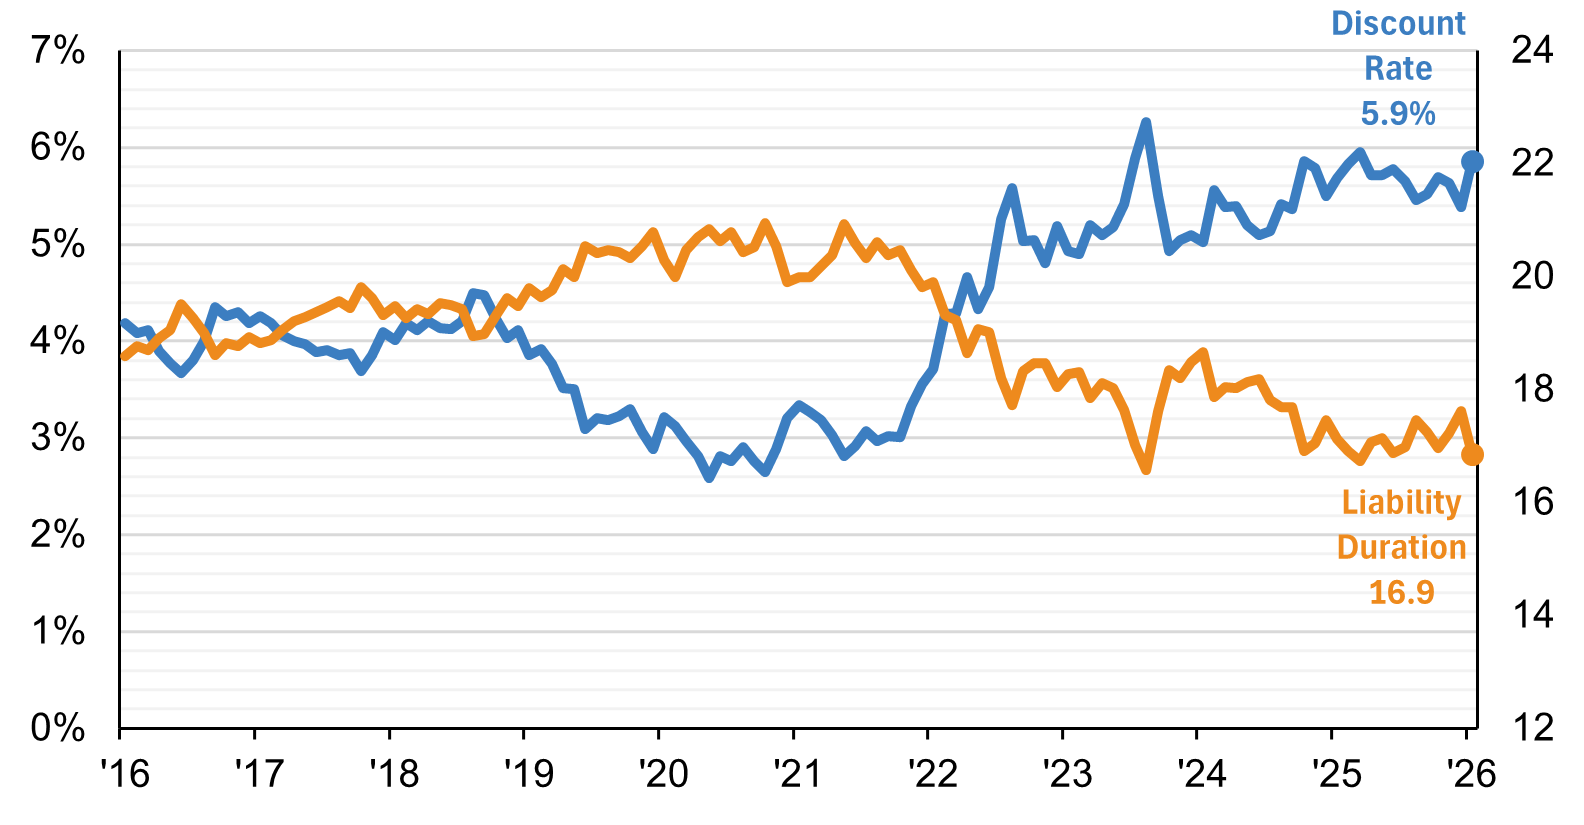
This chart tracks the Discount Rate and Liability Duration from 2016 through 2025. It highlights how interest rate changes and liability durations impact pension obligations over time. A rising discount rate typically reduces liabilities, while longer durations indicate greater sensitivity to rate changes which are key metrics for monitoring plan health. |
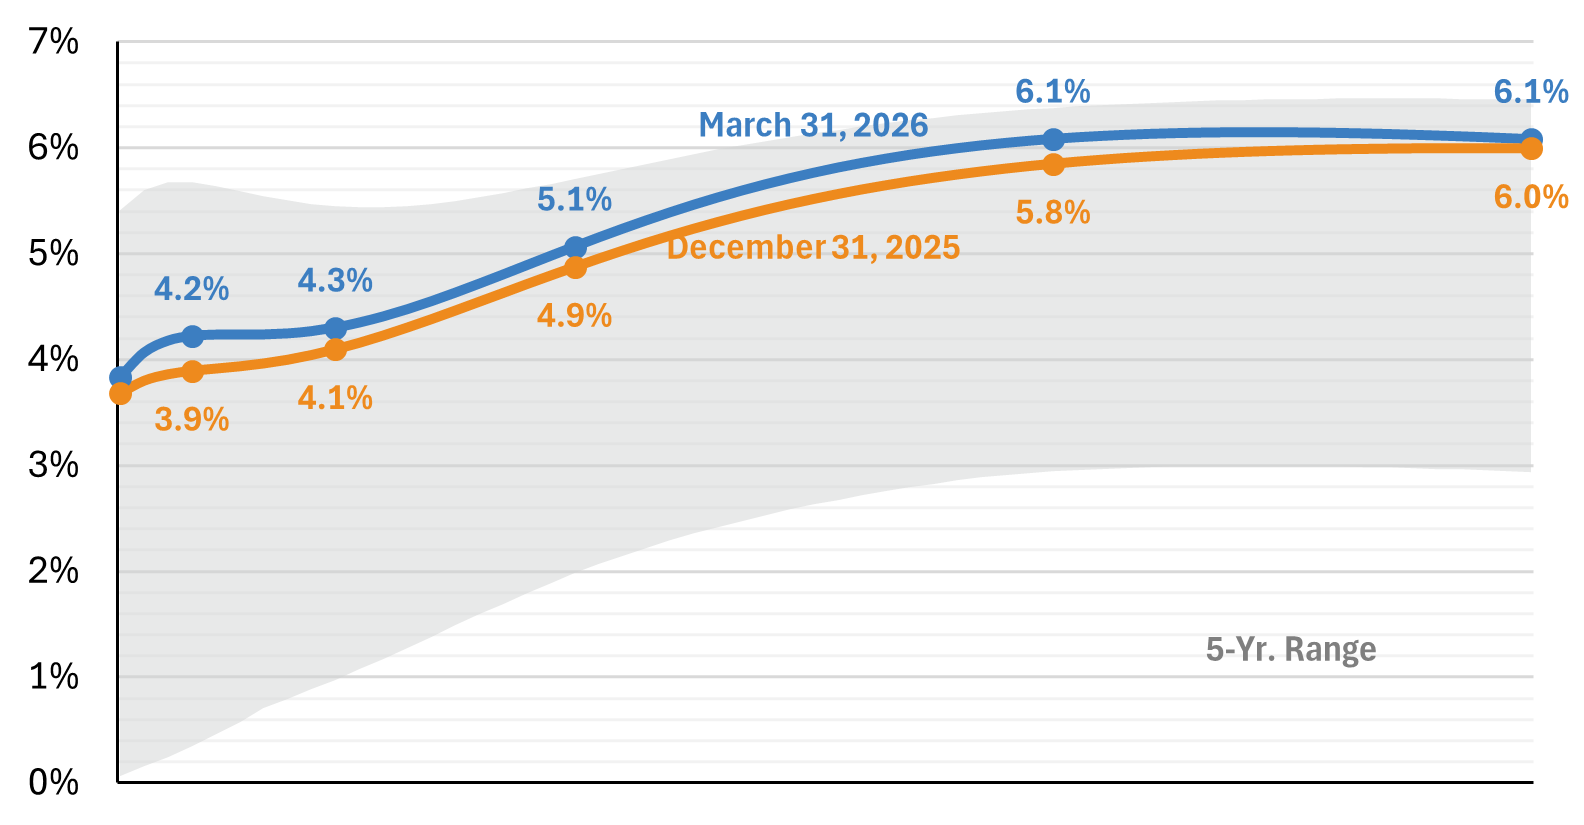
This curve compares pension liabilities across different maturities (6 months to 30 years) at two points in time. It shows how liabilities shift with changes in the yield curve, helping plan sponsors understand the timing and magnitude of future obligations. |
INDEX MODEL LIABILITIES |
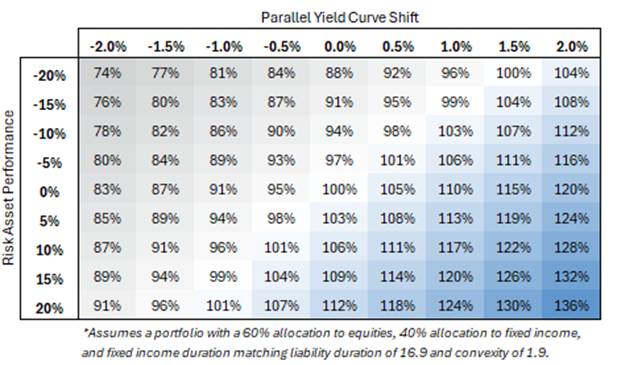
FUNDED STATUS SENSITIVITY |
|
This chart contrasts projected benefit payments with their present value across a 90-year horizon. It visualizes the long-term financial commitment of pension plans and the impact of discounting future benefits essential for evaluating funding strategies and sustainability. |
This chart helps plan sponsors understand how interest rate changes affect liabilities and funding levels which is critical for risk management and strategic planning. It shows how a pension plan’s funded status reacts to shifts in the yield curve, ranging from -2.0% to +2.0%. Each row represents a starting funded status (from 70% to 120%), and each column reflects the impact of interest rate changes. Blue cells indicate improved funding (typically from rising rates), while gray cells show deterioration (from falling rates). For example, a plan that is funded at 100% today could decline to 91% funded with a -2.0% decrease or rise to 111% with a +2.0% increase in interest rates.
|

Sources: USI Consulting Group. Data as of December 31, 2025.
STRATEGY BEFORE PLAN TERMINATION:
Surplus Management, De-Risking and the Role of Group Annuities
We hosted an informative webinar offering practical insights into the pension plan landscape and plan termination strategies.
If you couldn't attend, watch the on-demand webinar to learn about the strategy of de-risking, annuity placement and surplus management—and how these approaches impact the plan termination process.
How USI Consulting Group can help
At USI Consulting Group, we are pleased to offer the opportunity to purchase single premium annuity contracts through a menu of quality insurance carriers. Our actuaries and annuity product consultants are trained to assist clients on the merits and/or limitations of a single premium annuity purchase for their specific cases. Our proactive consulting by an integrated team can provide savings that exceed an individual de-risking strategy. To learn how we can help you, please reach out to us at information@usicg.com.
![]()
Investment advice provided to the Plan by USI Advisors, Inc. Under certain arrangements, securities offered to the Plan through USI Securities, Inc. Member FINRA/SIPC. Both USI Advisors, Inc. and USI Securities, Inc. are affiliates of USI Consulting Group. | 22126.S0126.99002
Not receiving our newsletter?
Stay up to date with retirement plan updates and insights by subscribing to our email list.