Market & Legal Update
February 2023
Market Update | February Head Fake?
Following a difficult 2022 and a promising recovery in January 2023, stocks finished lower for the month, with all three major U.S. indices closing out a volatile February in the red. Accordingly, the S&P 500 Index fell 2.4%, the Dow Jones Industrial Average shed 3.9%, and the NASDAQ lost just over 1%. Overseas, the MSCI EAFE Index lost 2% while the MSCI Emerging Market Index reversed course and dropped almost 6.5%. More troubling was the performance of bonds as the Bloomberg U.S. Aggregate Index fell 2.6% and high yield bonds, as measured by the Bloomberg High Yield Index, lost 1.3%. Like last year’s markets, bonds did not provide protection from equity losses in February.
Driving this market volatility was the failure to get relief from January’s inflation report, which was released on February 14th. As recently reported by the U.S. Bureau of Labor, the Consumer Price Index for All Urban Consumers (CPI-U) rose 0.5 percent in January on a seasonally adjusted basis, after increasing 0.1 percent in December. Over the last 12 months, the ‘all items index’ increased 6.4 percent before seasonal adjustments. Despite the monthly increase of 0.5%, inflation continued to slow on a year-over-year basis to 6.4%, according to the Bureau of Labor Statistics. This marks the seventh consecutive month that annual inflation has declined. More importantly, the core personal consumption expenditures price index (or “PCE”), released last Friday, the Fed’s preferred measurement of inflation, rose 0.6% in January and 4.7% from the prior year. Since inflation was above consensus, this has raised concerns that the Fed may have to keep rates higher for longer to quell inflationary pressures. In turn, the Fed’s higher for longer approach is expected to eventually take a toll on the economy and the overall labor market. However, the Labor Department’s report for the month showed a surprisingly strong jobs report, as 517,000 jobs were added to the U.S. economy in January 2023.

Strength in the labor market also pushed the unemployment rate to 3.4% versus the estimate for 3.6%—the lowest jobless level since May 1969. Although wage growth is slowing, as indicated by the slight drop in the three-month employment cost index — a comprehensive measure of wages and benefits for private-sector workers, continued strength in employment could fuel wage inflation and serve as a sign to the Federal Reserve to stay the course on their rate-hiking campaign. However, if wage growth continues to cool and we see a rise in unemployment, the Federal Reserve could over-tighten and drive the U.S. into a recession. Therefore, the challenge for the Fed is to slow down the economy through tighter monetary policy while not to being too hawkish to put the economy into a recession.
| Market Return Indexes | February 2023 | YTD 2023 | 2022 |
|---|---|---|---|
| Dow Jones Industrial Average | -3.9% | -1.1% | -6.9% |
| S&P 500 | -2.4% | 3.7% | -18.1% |
| NASDAQ (price change) | -1.1% | 9.5% | -33.1% |
| MSCI Eur. Australasia Far East (EAFE) | -2.1% | 5.8% | -14.5% |
| MSCI Emerging Markets | -6.5% | 0.9% | -20.1% |
| Bloomberg High Yield | -1.3% | 2.5% | -11.2% |
| Bloomberg U.S. Aggregate Bond | -2.6% | 0.4% | -13.0% |
| Yield Data | February 2023 | January 2023 | December 2022 |
| U.S. 10-Year Treasury Yield | 3.94% | 3.52% | 3.88% |
Given the volatile start to the year, the short-term future of the markets in 2023 remains shaky. There are several unresolved concerns, including persistently high global inflation, geopolitical risks (e.g., Taiwan/Ukraine or China/Russia), and rising interest rates and other monetary tightening. Although these are serious risks, they are not new and should be a reminder to always periodically reevaluate your risk/return preferences to ensure your allocations are aligned. In conclusion, a return to more reasonable valuations and rational pricing is good for the economy and the markets.
Legal Update | SECURE 2.0 and the Expansion of Self-Correction Under EPCRS
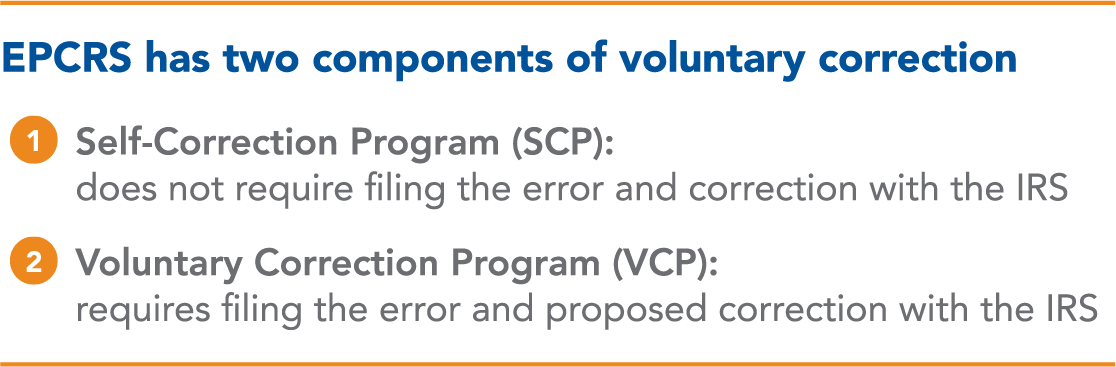
As part of our ongoing efforts to summarize certain provisions of the SECURE 2.0 Act of 2022 (SECURE 2.0), this month’s update is focused on the provision which expands the ability to self-correct retirement plan failures under the IRS’ correction program, Employee Plans Compliance Resolution System, (EPCRS). By way of background, EPCRS has two components of voluntary correction, the Self-Correction Program (SCP) which does not require filing the error and correction with the IRS, and the Voluntary Correction Program (VCP) which requires filing the error and proposed correction with the IRS, requesting their approval of the correction through the issuance of a compliance statement. Prior to the enactment of SECURE 2.0, significant plan failures could only be corrected under SCP if they were corrected within three years after the plan year in which the error occurred; otherwise, significant errors had to be corrected under VCP.
SECURE 2.0 has broadened the ability to correct plan errors by SCP for any “eligible inadvertent failure,” which is defined to include any failure to meet the requirements of the IRS Code despite the existence of the plan sponsor’s practices and procedures that are designed to promote regulatory compliance. An inadvertent failure does not include any failure that is egregious, relates to the diversion or misuse of plan assets, or is directly or indirectly related to an abusive tax avoidance transaction.
In order to self-correct an inadvertent failure under SCP, the error must be corrected within a reasonable period after being identified by the plan sponsor, and the error must not have been identified by the IRS prior to plan sponsor’s efforts to self-correct the error.
In addition, SECURE 2.0 allows plan sponsors to self-correct for inadvertent plan loan failures. Previously, most plan loan errors had to be corrected through VCP.
The SECURE 2.0 provision that permits the ability to correct inadvertent failures by self-correction was effective as of the date of enactment, December 29, 2022. Although the provision is currently in effect, the IRS has a two-year period to update the Revenue Procedures for EPCRS and provide additional guidance regarding this statutory change to the retirement plan correction rules.
USI Consulting Group Comment
SECURE 2.0 appears to have considerably broadened the ability to correct errors under SCP by introducing the concept of “inadvertent failure,” and expanding the time-period in which the plan has to self-correct an error. While it has been our experience that most errors tend to be inadvertent in nature, we will be interested in the IRS updates to the Revenue Procedures and how they will interpret this expansive provision for self-correction.
How USI Consulting Group (USICG) Assists
The USICG team can help answer any questions that you have regarding SECURE 2.0 and its discretionary and required changes to your plan. Both the IRS and the DOL will be issuing additional guidance regarding the SECURE 2.0 provisions and as soon as additional information becomes available, we will provide updates to inform you about such guidance and its impact on plan compliance and administration.
Retirement Resources for You
The USI Consulting Group team is happy to assist employers with all retirement plan compliance matters and changes in the market, including those discussed here, to help you mitigate risk and financial impact to your organization.
Questions? Contact your USICG representative, visit our Contact Us page or reach out to us directly at information@usicg.com.
Find the address and telephone number of your local USI Consulting Group office here.
Print this February 2023 Market & Legal Update
For previous market and legal commentaries please click here.
This communication is published for general informational purposes and is not intended as advice or a recommendation specific to your plan. Neither USI nor its affiliates and/or employees/agents offer legal or tax advice.
An index is a measure of value changes in a representative grouping of stocks, bonds, or other securities. Indexes are used primarily for comparative performance measurement and as a gauge of movements in financial markets. You cannot invest directly in an index and, for comparative purposes; they do not reflect the effect of the various fees inherent in actual investment vehicles.
The S&P 500 Index is a market value weighted index showing the change in the aggregate market value of 500 U.S. stocks. It is a commonly used measure of stock market total return performance.
The Dow Jones Industrial Average is a price weighted index comprised of 30 actively traded blue chip stocks; primarily industrial companies, but including some service oriented firms.
The NASDAQ Composite Index is a market-value weighted index that measures all domestic and non-U.S. based securities listed on the NASDAQ Stock Market.
Gross Domestic Product (GDP) is the market value of the goods and services produced by labor and property in the U.S. It is comprised of consumer and government purchases, net exports of goods and services, and private domestic investments. The Commerce Department releases figures for GDP on a quarterly basis. Inflation adjusted GDP (or real GDP) is used to measure growth of the U.S. economy.
The MSCI Europe and Australasia, Far East Equity Index (EAFE) is a market capitalization weighted unmanaged index developed by Morgan Stanley Capital International to measure approximately 1,100 securities in 21 major overseas stock markets. It is a commonly used measure for foreign stock market performance.
The Barclays Capital U.S. Aggregate Index covers the U.S. Dollar denominated investment grade, fixed-rate, taxable bond market of SEC-registered securities.
The Barclays Capital U.S. Corporate High Yield Index covers the U.S. Dollar denominated, non-investment grade, fixed income, taxable corporate bond market. Securities are classified as high-yield if the middle rating of Moody’s Fitch, and S&P is Ba1/BB+/BB+ or below.
The MSCI Emerging Markets Index (EM) is a free-float-adjusted market-capitalization index developed by Morgan Stanley Capital International. It is designed to measure the equity market performance of 26 emerging market countries.
The 10 Year Treasury Yield is the interest rate the U.S. government pays to borrow money for a 10-year period. In addition to influencing how much the government pays to borrow over this time-frame, the 10-year Treasury Yields also determines how much investors earn by investing in this debt and it is a good indicator of investor sentiment The higher the yield, the better the economic outlook.
Market Update is a monthly publication circulated by USI Advisors, Inc. and is designed to highlight various market and economic information. It is not intended to interpret laws or regulations.
This report has been prepared solely for informational purposes, based upon information generally available to the public from sources believed to be reliable, but no representation or warranty is given with respect to its completeness. This report is not designed to be a comprehensive analysis of any topic discussed herein, and should not be relied upon as the only source of information. Additionally, this report is not intended to represent advice or a recommendation of any kind, as it does not consider the specific investment objectives, financial situation and/or particular needs of any individual client.
Investment Advice provided by USI Advisors, Inc. Under certain arrangements, securities offered to the Plan through USI Securities, Inc. Member FINRA/SIPC. 95 Glastonbury Blvd., Suite 102, Glastonbury, CT 06033. USI Consulting Group is an affiliate of both USI Advisors, Inc. and USI Securities, Inc.
5023.S0302.0020
RECENT PUBLICATIONS
- June 2026 | Market & Legal Update 7/6/2026
- May 2026 | Market & Legal Update 6/3/2026
- April 2026 | Market & Legal Update 5/4/2026
Not receiving our newsletter?
Stay up to date with retirement plan updates and insights by subscribing to our email list.